一些分布
统计学中有各种各样的分布,工作中经常遇到,简单总结一下。
伯努利分布
印象:
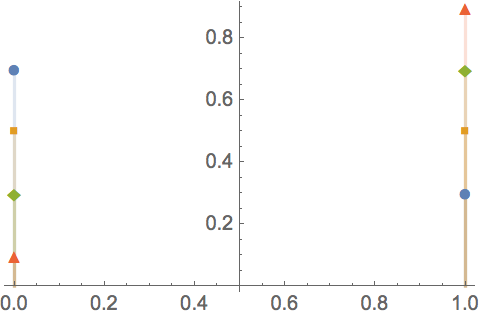
典型的如投硬币例子,又叫coin toss distribution或Bernoulli trial,可表征随机事件在1/0上的概率分布。简单的讲,就是x=1的时候概率为p,x=0的时候概率为1-p,分布随p值不同而变化。
例子:
比如广告一次曝光,可看做一次伯努利实验,点击率ctr可认为是概率p。
图示:
比如当p={0.3, 0.5, 0.7, 0.9}时,对应的probability mass function
公式:
二项分布
印象:
Binomial distribution represents a binomial distribution with n trials and success probability p.
简单讲就是独立重复n此伯努利实验,实验成功概率是p,那么二巷分布表示实验成功次数的概率分布。如重复3次实验,可得到其在{0, 1, 2, 3}上的概率。
例子:
比如n次广告或商品曝光,可看做参数为(n, ctr)的二项分布;在比如连续抛n次硬币,正面朝上次数的概率分布。
图示:
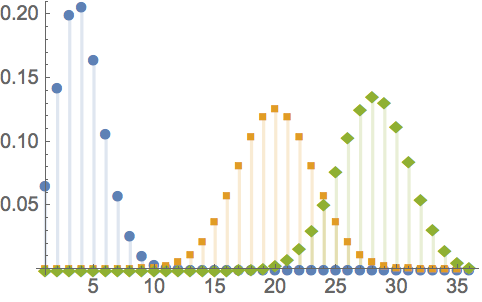
当n=40以及p={0.1, 0.5, 0.7}时候,对应的概率分布:
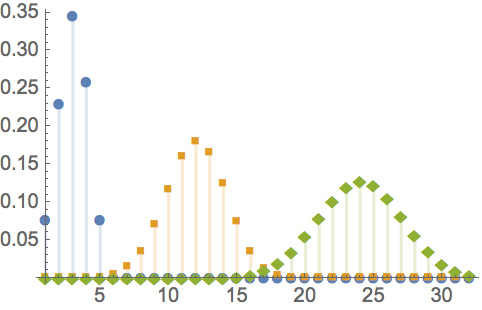
当p=0.6以及n={5, 20, 40}时候,对应的概率分布:
公式:
Beta分布
印象:
The short version is that the Beta distribution can be understood as representing a distribution of probabilities- that is, it represents all the possible values of a probability when we don’t know what that probability is.
最直观的理解,Beta分布可看做关于概率的分布,是在x=[0, 1]上的分布,x可解释为某概率值。
例子:
比如What is the intuition behind beta distribution里讲到的棒球例子,可以用Beta分布建模棒球运动员的batting average。当球员击球次数较少,batting average估计偏差很大,由先验知道,一般在(0.215, 0.36)之间。选手击球序列可表示为一个二项分布,表征batting average并考虑先验可利用Beta分布建模,使预估更准确。
再比如广告点击率预估,当曝光次数较少时,预估的点击率方差较大,不太可靠:
- 曝光1次,点击,则点击率为1(显然高估)
- 曝光1000次,未点击,则点击率为0(广告点击率0.1%很常见)
利用Beta分布建模,考虑先验信息,可以使预估更准确。详细参考论文Click-Through Rate Estimation for Rare Events in Online Advertising。
图示:
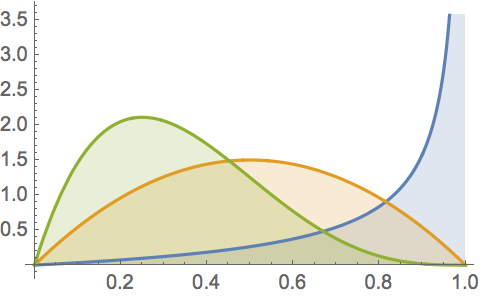
当$\alpha=2$,$\beta \in {0.25, 2, 4}$的时候,对应概率密度函数:
公式:
BetaDistribution[α,β] represents a statistical distribution defined over the interval and parametrized by two positive values α, β known as “shape parameters”, which, roughly speaking, determine the “fatness” of the left and right tails in the probability density function (PDF). Depending on the values of α and β, the PDF of the beta distribution may be monotonic increasing, monotonic decreasing, or unimodal with potential singularities approaching the boundaries of its domain.
- 两个参数可取任何大于0的数
- 两个参数较小时候,曲线比较平坦,在各个概率上分布可能性越大
- 两个参数越大,曲线与集中,期望概率的可能性越大
- 结合新的观察样本,后验概率更新后,会慢慢更接近真实值
在RStudio里可以方便地看参数变化的影响
curve(dbeta(x, 81, 219))